Restaurant Menu Profitability Analysis Guide

A busy Friday can make a menu look successful while quietly draining profit. A popular plate may be underpriced, a high-margin item may be buried on page two, and a delivery version of the same menu may carry fees that erase its contribution. This restaurant menu profitability analysis guide helps operators find those gaps and turn menu decisions into practical operational improvements.
The goal is not to remove every low-margin item or raise every price. It is to understand what each item contributes after food cost, labor demands, waste, discounts, and channel fees. Then you can make controlled changes that protect the customer experience while improving the numbers behind it.
Start With Clean Menu and Sales Data
A profitability analysis is only as useful as the data behind it. Before evaluating items, make sure the menu in your POS reflects what the kitchen actually produces. Duplicate buttons, outdated prices, inconsistent modifier names, and items sold under generic categories will distort the results.
Pull at least 8 to 12 weeks of item-level sales data from your POS. Longer periods are helpful when sales fluctuate by season, but do not rely on old data if recipe costs or vendor pricing have changed recently. Include dine-in, pickup, online ordering, and delivery sales separately whenever possible. A burger sold through a third-party delivery app is not necessarily as profitable as the same burger sold in-house.
For each item, organize sales volume, selling price, discounts, refunds, modifier activity, and sales channel. Then compare that information against current recipe costs. If the recipe card says a portion uses six ounces of chicken but the line routinely serves eight, your analysis will look better on paper than it performs in the kitchen.
Calculate the Numbers That Matter
Food cost percentage is useful, but it should not make the decision by itself. An item with a 35% food cost can produce more dollars per sale than an item with a 25% food cost. What matters most is contribution margin: the dollars left after direct food and packaging costs are removed from the selling price.
Use this simple formula:
Contribution margin = Menu price – Direct food cost – Direct packaging cost
For delivery items, subtract the relevant channel costs as well. This may include commission, promotional funding, delivery-specific packaging, or menu-price differences. You do not need to assign rent or every fixed expense to each dish at this stage. The purpose is to see which menu items generate dollars that help cover labor, overhead, and profit.
For example, a $16 pasta dish with $5.60 in food and packaging cost contributes $10.40 per sale. A $12 appetizer with a $3 cost contributes $9. That appetizer has a lower food cost percentage, but the pasta still generates more contribution dollars. If the pasta sells frequently and does not create a major prep bottleneck, it may be a stronger item for the business.
Labor also belongs in the conversation, especially for items that require extensive prep, complicated plating, or frequent remakes. You may not need a precise labor cost per plate to see the issue. If one menu item ties up a cook for five minutes during peak service while producing a thin margin, it deserves attention.
Compare Profitability With Popularity
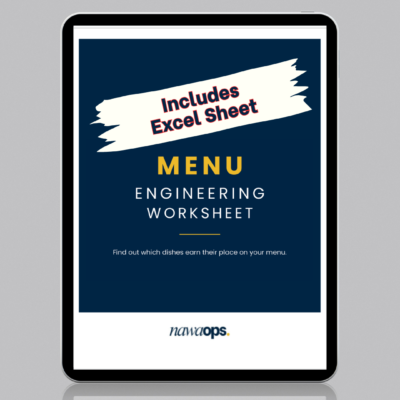
Once contribution margin is clear, compare it with how often each item sells. This creates a more useful picture than looking at food cost alone.
High-profit, high-popularity items are the menu’s workhorses. Protect their quality, placement, and availability. These are often the items worth featuring in staff recommendations, menu callouts, combo offers, and online ordering categories.
High-profit, low-popularity items may be under-marketed, poorly named, hard to find, or simply not a fit for your current customer base. Before removing them, test better placement, a clearer description, a photo where appropriate, or a staff selling prompt. A strong-margin dish that needs one better sentence on the menu is a different problem than a dish customers genuinely do not want.
Low-profit, high-popularity items require the most care. Raising the price may be justified, but price is not the only lever. Check portion size, vendor costs, waste, modifier abuse, and whether the item can be paired with a profitable add-on. A popular chicken sandwich may remain a traffic driver, but it should not be allowed to consume margin through oversized portions and uncharged upgrades.
Low-profit, low-popularity items are the clearest candidates for removal, reformulation, or replacement. These items often create hidden complexity: unique ingredients, extra prep, training confusion, and more chances for waste. Removing one weak item can improve purchasing and execution across the entire kitchen.
Verify Recipe Costs Before Changing Prices
Menu analysis often exposes a basic operational problem: recipes are not standardized. Without portion sizes, yield calculations, prep instructions, and approved substitutions, no one can confidently say what a dish costs.
Update costs using current invoices, not memory. Account for trim loss, cooking yield, sauces, garnish, fryer oil impact where relevant, and takeout packaging. A protein may appear affordable by the pound until usable yield and portion creep are included.
Then watch the line. Ask whether staff use scales, scoops, ladles, and portion tools consistently. A recipe that depends on visual estimates will produce inconsistent cost and inconsistent guest experience. Standardized recipes are not paperwork for its own sake. They give managers a reliable baseline for pricing, ordering, training, and accountability.
Make Targeted Changes, Not a Menu Overhaul
A full redesign is sometimes necessary, but most restaurants improve profitability faster through a short list of focused adjustments. Start with the items that create the largest financial impact or operational friction.
You may decide to increase the price of two underpriced best sellers, reduce a protein portion by one ounce, add a charge for premium modifiers, or replace an expensive side with one that uses existing inventory. You may also consolidate ingredients across several dishes so purchasing is simpler and fewer products expire in the walk-in.
Be careful with broad price increases. If your menu is already above the local market, a large jump can reduce traffic or push guests toward lower-margin choices. It depends on your concept, competition, portion perception, service level, and customer loyalty. Test changes in a controlled way and monitor sales mix, not just total sales.
Descriptions matter too. A clear name and concise explanation can improve ordering confidence, especially for signature items or dishes unfamiliar to new customers. On digital menus, place profitable, easy-to-execute items where customers can find them without scrolling through long, repetitive categories.
Keep Every Sales Channel Aligned
A price change is only complete when it appears everywhere customers order. The POS, printed menu, online ordering site, delivery platforms, QR menu, and staff training materials should reflect the same item names, prices, modifiers, and availability rules.
Misalignment creates avoidable loss. A guest orders a modifier online that the kitchen no longer supports. A delivery platform shows an old price. A cashier rings an item under a legacy button with the wrong cost assumptions. These issues create refunds, remakes, staff confusion, and unreliable reporting.
Build a simple menu-change process: approve the change, update the recipe and cost sheet, update every ordering channel, brief the team, and verify a test order. NawaOps often sees that the operational follow-through is where otherwise smart menu decisions break down.
Review Results on a Schedule
Menu profitability is not a one-time project. Vendor prices move, customer preferences change, and a new delivery promotion can shift your sales mix in a week. Review core menu performance monthly, with a deeper analysis each quarter or after major price, supplier, or concept changes.
Track whether the change improved contribution dollars, not only food cost percentage. Also watch ticket average, item mix, voids, guest feedback, prep time, and waste. A menu item that looks profitable but causes repeated execution problems may still need to be redesigned.
The strongest menu is not the one with the lowest food cost on paper. It is the one your team can execute consistently, your systems can report accurately, and your customers choose often enough to support healthy margins. Start with the data you have, correct the operational gaps it reveals, and let each menu change make the next service easier to run.
Is Your Menu Working as Hard as Your Kitchen?
We analyze POS workflows, item engineering, and design layout to eliminate operational bottlenecks and boost profitability.